In the terminal, run the test example as follows:
./geodisp input.test

Hereunder are shown all the output graphs generated by GeoDiSP regarding this signal:
stats_serie1.ps 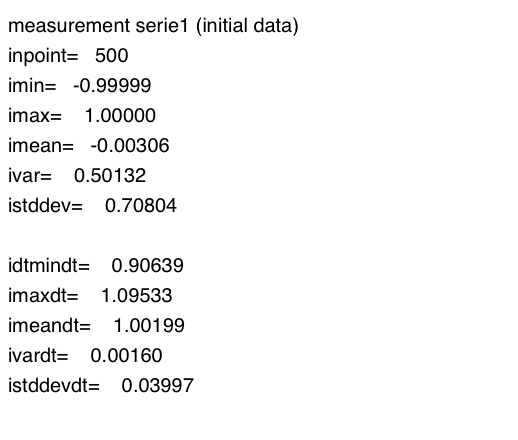 |
isignal_serie1.ps 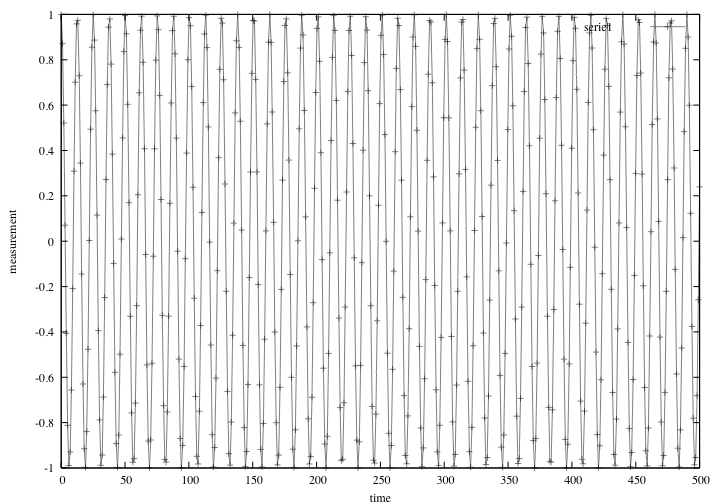 |
rsignal_serie1.ps 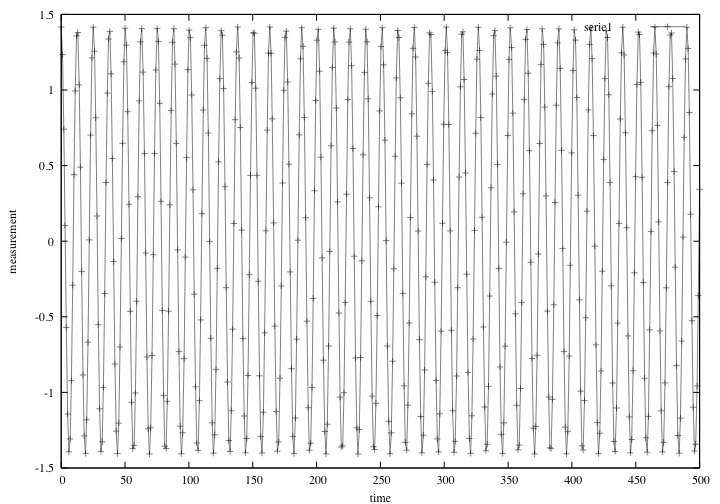 |
nsignal_serie1.ps 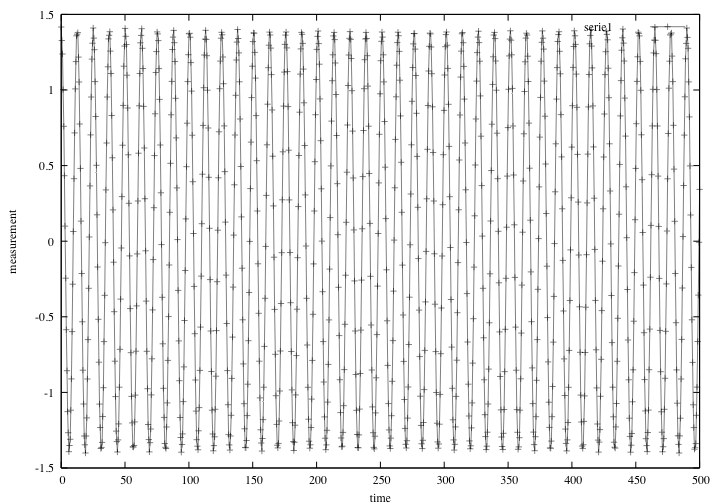 |
both_signals_serie1.ps 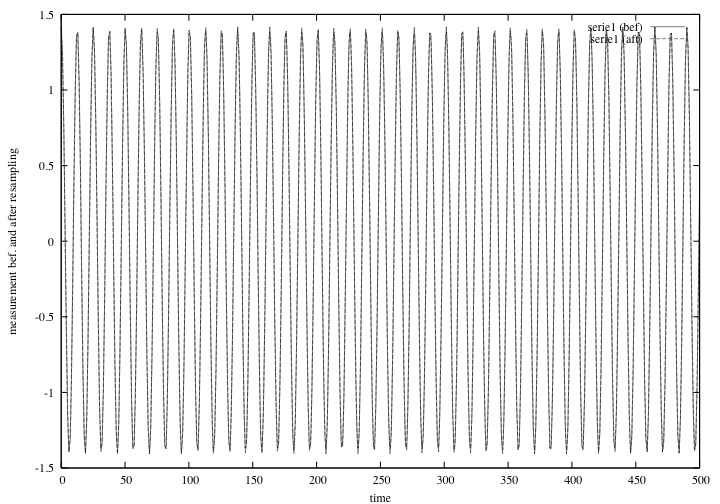 |
lomb_transform_serie1.ps |
sig95_serie1.jpg  |
wave_ps_sig95_serie1.ps 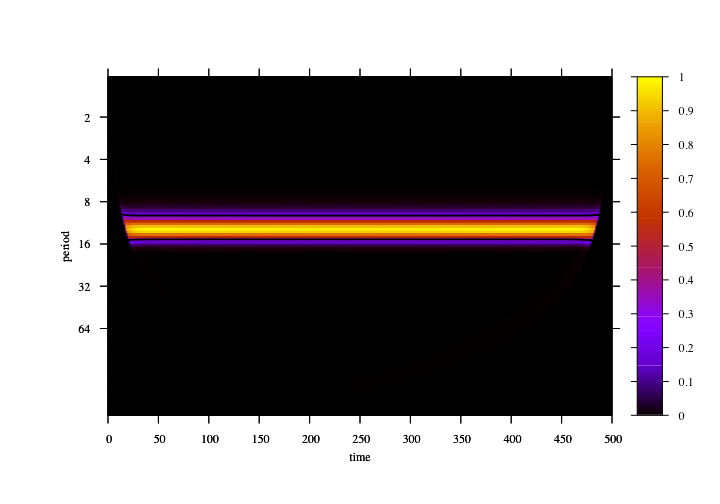 |
global_ws_serie1.ps 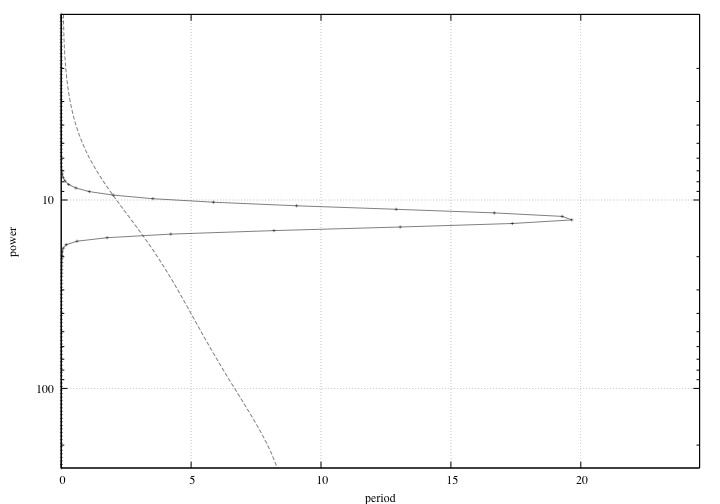 |
The frequency of the signal is the inverse of the period and is therefore approximately equal to 0.0796, the value on which the pic of the Lomb transform is centered. On the other hand, the period value, approximately equal to 12.566 is visible on the wavelet power spectrum as the horizontal yellow band, and also on the global wavelet spectrum image.

Hereunder are shown all the output graphs generated by GeoDiSP regarding this signal:
stats_serie2.ps  |
isignal_serie2.ps  |
rsignal_serie2.ps 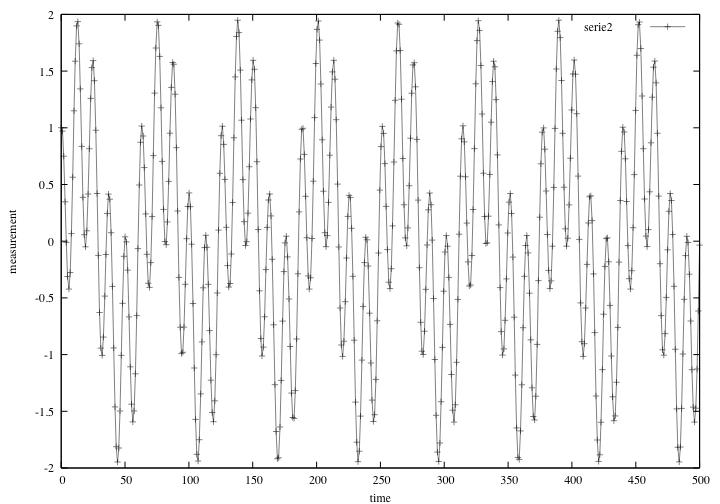 |
nsignal_serie2.ps 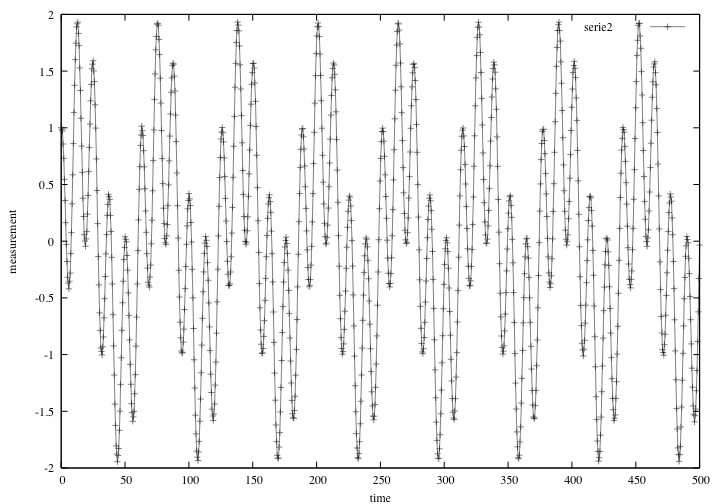 |
both_signals_serie2.ps 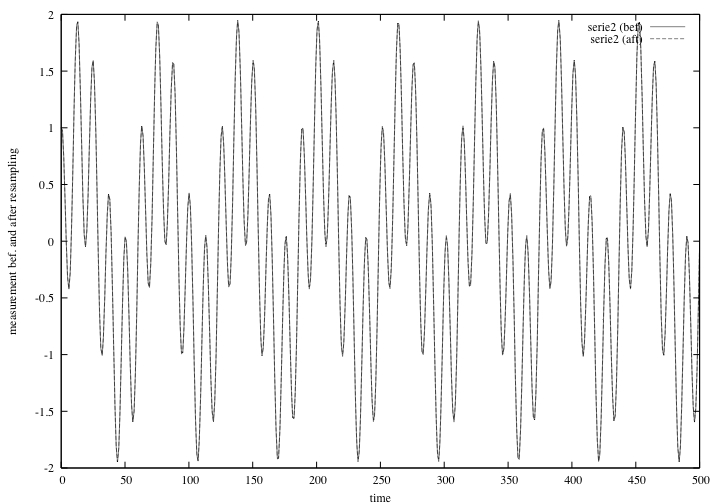 |
lomb_transform_serie2.ps |
sig95_serie2.jpg 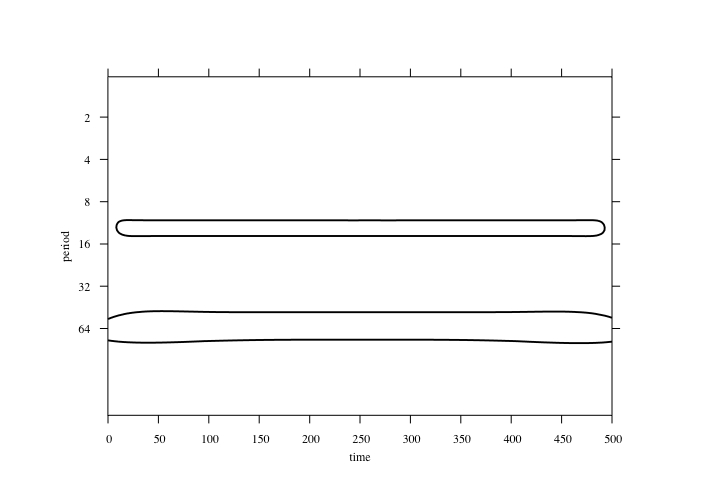 |
wave_ps_sig95_serie2.ps 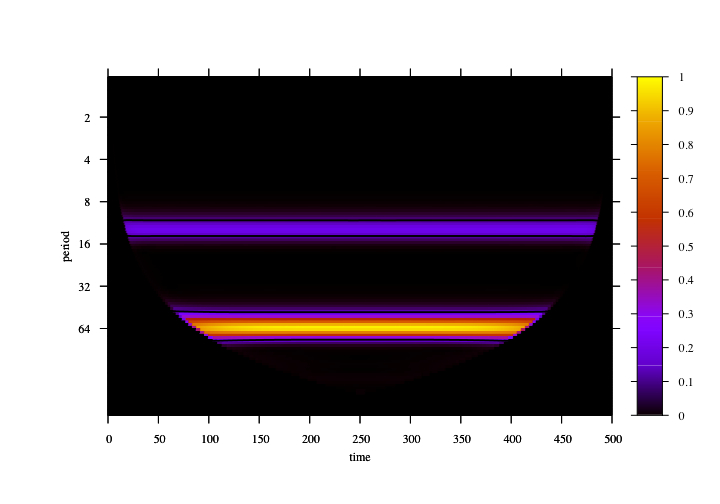 |
global_ws_serie2.ps 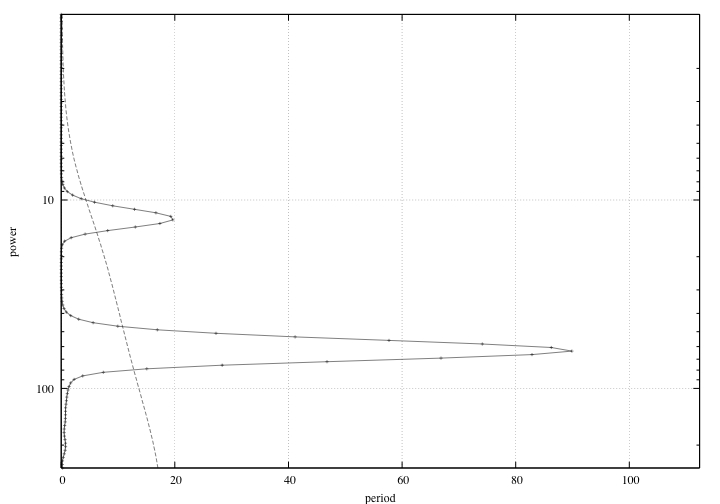 |
The two frequencies present in the signal are approximately equal to 0.0796 and 0.0159, the two values on which the pics of the Lomb transform are centered. The period values, approximately equal to 12.566 and 62.832 are visible on the wavelet power spectrum as the two horizontal bands, and also on the global wavelet spectrum image.

Hereunder are shown all the output graphs generated by GeoDiSP regarding this signal:
stats_serie3.ps 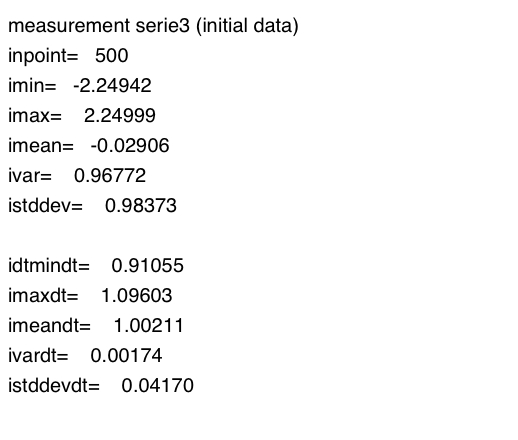 |
isignal_serie3.ps 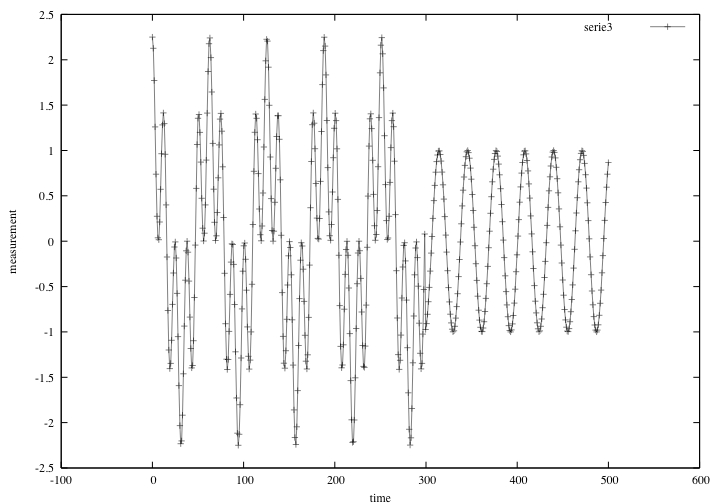 |
rsignal_serie3.ps 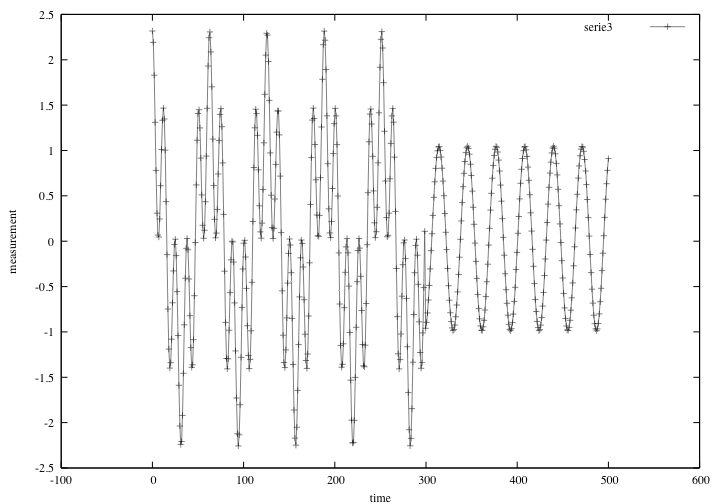 |
nsignal_serie3.ps 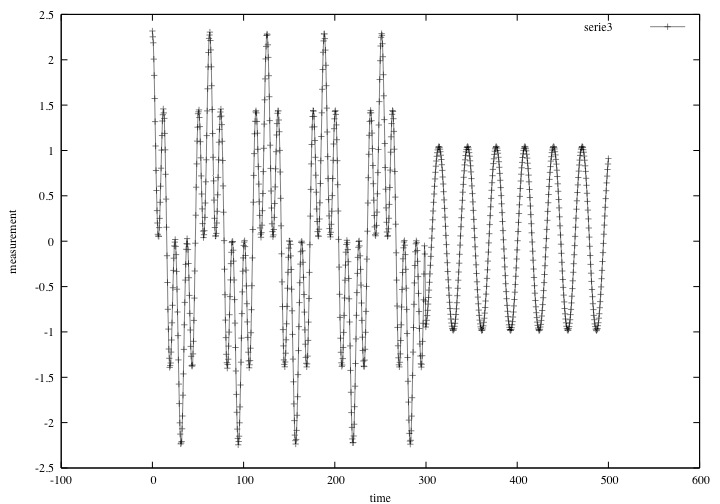 |
both_signals_serie3.ps 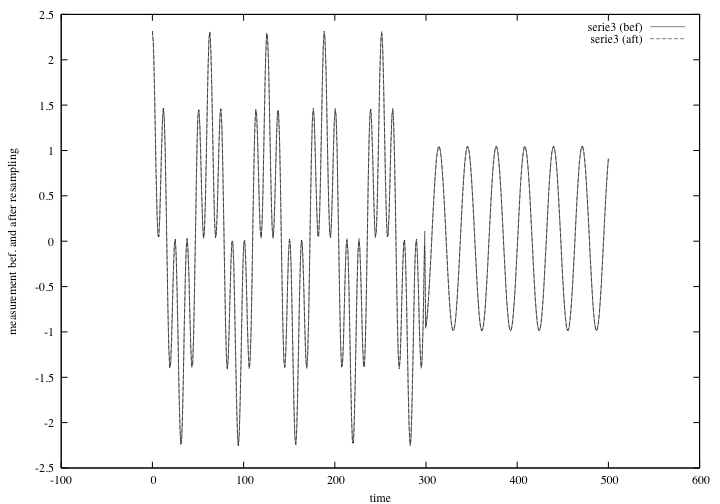 |
lomb_transform_serie3.ps |
sig95_serie3.jpg 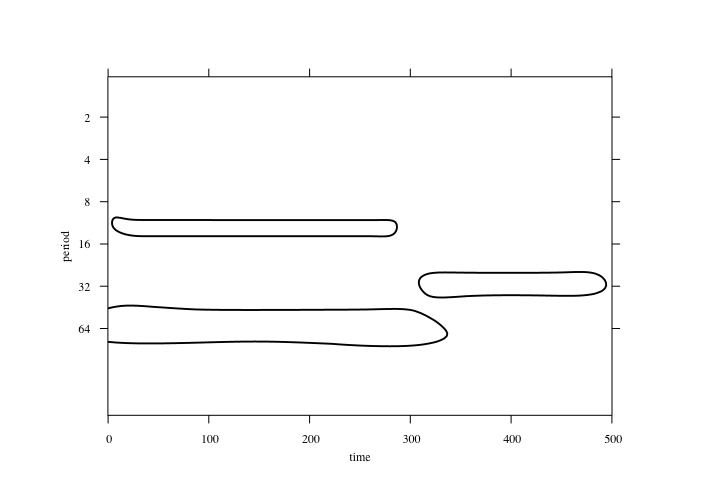 |
wave_ps_sig95_serie3.ps 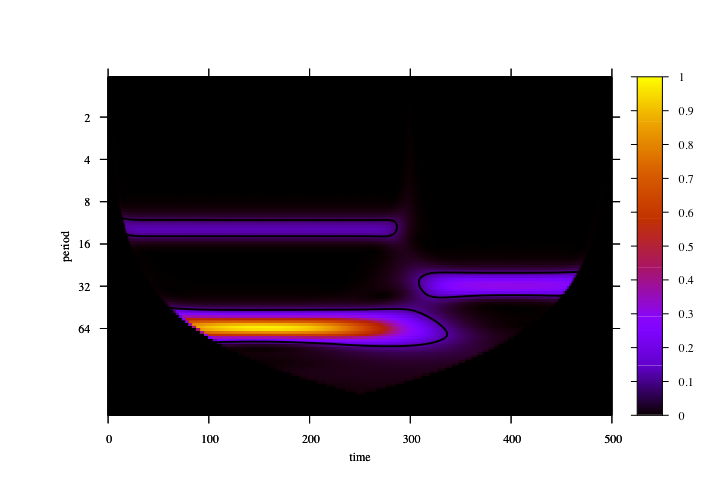 |
global_ws_serie3.ps 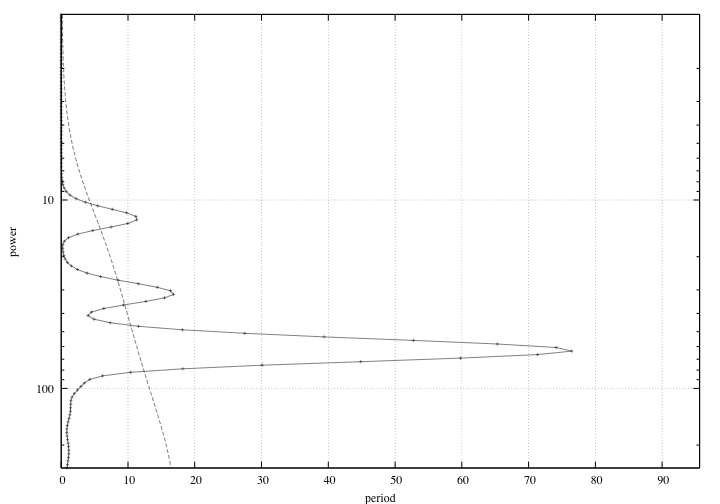 |
